
It happens every NHL season. Some team (or teams) have terrible Corsi shot metrics, but have decent or really good expected goal or scoring chance metrics. "Quality over quantity", people will say. "It's the system they play", people will say.
It's not a crazy idea, right? We've known possession matters for years. So if you get better chances, you should have better success! Put another way - if you asked 200 Hockey Men to choose between Quantity and Quality, all 200 would choose Quality, right?
But hockey isn't such a clean A+B=C game. It's not easy to get scoring chances, and the predictive value of a team's scoring chances to future goal scoring is not so clear. In fact I don't believe there is any online analysis of the predictive value of "scoring chances" as used by NaturalStatTrick. We do know some expected goal models (which involve more variables than the traditional "scoring chances") have found a stronger predictive power, some less, though these are all older studies. I think more current models are more complex (and are popping up more frequently), so better analysis is probably on the way.
But as the Rangers season falls apart, I finally got a chance to look at something I've wanted to see in visual form for a while: What type of success do teams that have bad Corsi, but good Quality, have? Should a team be willing to sacrifice overall shot share to get those *really good* chances? Short answer: All other things being equal, probably not.
For this post, I pulled all team CorsiFor% and HighDangerChanceFor% from Natural Stat Trick (5v5, score- and venue-adjusted) between 2010 and 2017. [I did not go back prior to 2010 because apparently pre-2010 NHL shot location data is incomplete.]
I chose to look at scoring chances instead of expected goals because I believe [with little evidence to be sure] that these "scoring chances" are probably much closer to what NHL coaches track as "scoring chances". In other words, I don't think most NHL coaches are tracking a sophisticated model like expected goals - but I wouldn't be surprised if they all have some sort of more simple scoring chance +/- based on shot types, and locations. So for this post, I'm not worrying about the "binning" issues associated with "scoring chances", but people who aren't sure what I'm talking about should read this and this.
First, let's look at CorsiFor% compared to HDCF% for all teams in the period.

data from NaturalStatTrick.com (5v5, SV-adjusted)
Pretty easy to see the strong relationship between a team's CF% and its HDCF%. Better shot quantity teams tend to have better shot quality.
We could really stop here, but what's the fun in that? I want to see those teams that we hear about prioritizing Quality over Quantity. The ones who have bad CF%, but good HDCF%. Here are the top 50 teams ranked by the difference between their HDCF% and their CF%.
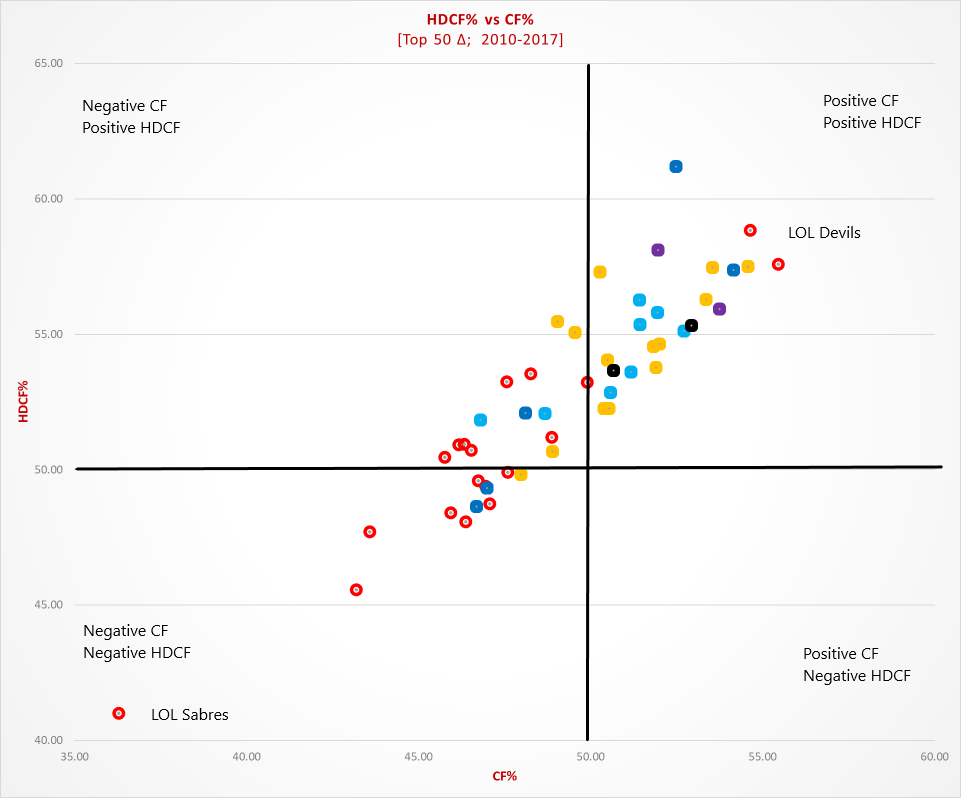
data from NaturalStatTrick.com (5v5, SV-adjusted)
The colors correspond to how far these teams made it in the playoffs. Red circles are teams that did not qualify. Orange for teams that lost in 1st Round...getting darker until we get to Black for teams that won the Cup. What's important here - there are only 2 red circles in the top right (LOL DEVILS), and very few darker colored circles on the left side (the negative CF% side). Bad CF% teams don't get very far in the playoffs, if they make it at all, even if they have good HDCF%.
But as you see, this includes good teams too - most of the teams that have a large gap between HDCF% and CF% are still good CF% teams. Still not fun enough.

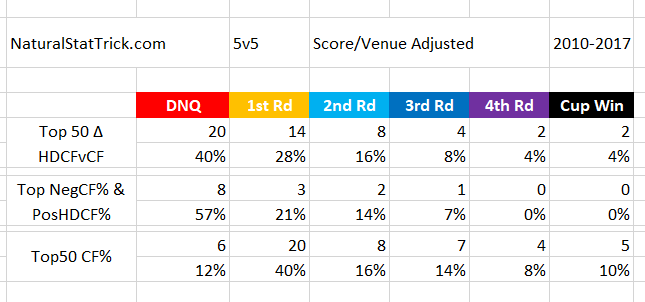
data from NaturalStatTrick.com (5v5, SV-adjusted)
Fourteen teams with a below-50 CF%, and above-50 HDCF% in this sample. Eight of those still missed the playoffs. Only the 2011/12 Rangers made it past the second round. [Reminder - this is just a subset of the teams in the first graph. There may be other bad CF/good HDCF teams out there, but if there are, the difference between HDCF/CF is not large]
Finally, let's look at the top 50 CF% teams overall, and how they fared.

data from NaturalStatTrick.com (5v5, SV-adjusted)
Obviously the top 50 CF% teams are all going to have above-50 CF%, and as you see, only a few of those have below-50 HDCF%. We've got 5 Cup winners, 4 Cup finals losers, and 7 that made it to the 3rd Round. Overall, a lot more blacks, purples, and blues than reds.
data from NaturalStatTrick.com (5v5, SV-adjusted)
This just shows the chart data with percentages. Note the extreme difference between the bottom two row sets. 88% of the Top 50 CF% teams made the playoffs. 32% of those made it to at least the 3rd Round (Conference Finals). Compare that to the 14 "bad CF%/good HDCF% teams", where only 6 even made it to the playoffs, and 3 survived the first round.
So what difference does it make?
Obviously, making the playoffs, and then succeeding in the playoffs, depends on more than just a team's share of shots and scoring chances. The value of a hot goaltender, especially in the playoffs, may have as much to do with how far the playoff teams included here have gone as anything having to do with scoring chances.
But it's hard to look at this and think that teams are "better off" sacrificing shot share in order to get better quality chances. First, that rarely happens. And when it does, those few teams rarely succeed in the playoffs. Maybe a coach saying his team prefers Quantity over Quality is just trying to put a positive spin on a bad situation.
So it's probably not a matter of prioritizing Quality over Quantity. It's probably more accurate to say that Quantity drives Quality. Get more shots, and you are probably a better team, and that will likely get you better chances.
...Again I'm right in my analysis.
Support NaturalStatTrick here.